The S&P 500 (SP500) on Friday slid 4.87% for the month of September to close at 4,288.15 points. Its accompanying SPDR S&P 500 Trust ETF (NYSEARCA:SPY) lost 5.08% for the month.
September has historically been the worst month of the year for markets, and that trend certainly continued in 2023. Wall Street’s benchmark index turned in its worst monthly performance since December 2022, and posted back-to-back monthly declines for the first time since – coincidentally – August and September last year.
This month’s retreat was primarily due to the Federal Reserve. The central bank’s monetary policy committee on September 20 held interest rates steady as widely expected. However, the Fed’s updated dot plot of economic and rate projections was significantly more hawkish than anticipated. Furthermore, chief Jerome Powell said that a soft landing was not a baseline expectation.
Markets were shaken by the clear signal of higher rates for longer, and equities and bonds were gripped in a bruising sell-off in the aftermath. Apart from the Fed, surging crude oil prices, mixed economic data, an extended pullback in technology stocks, a major strike by the United Auto Workers against the “Detroit Three” carmakers, and a potential government shutdown also weighed on positive sentiment in September.
“Our view since the end of July was that the market would be challenged in the seasonally challenging period of August through September. In the first half, the market was boosted by economic, earnings and inflation data that came in better than feared. However, as we moved into the second half, the bar for positive surprises was raised,” Keith Lerner, co-chief investment officer at Truist, told Seeking Alpha.
“More recently, investors have had to deal with the headwinds of higher interest rates, higher oil prices, the UAW strike, the restart of student loan payments and the potential of government shutdown. Moreover, there has been a lack of positive catalysts. Out of all the factors, the most challenging for the market, in our view, has been the sharp rise in the 10-year U.S Treasury yield (US10Y) which has jumped from near 4% to above 4.5% and pressured valuations,” Lerner said.
After a blistering rally in H1 of 2023 that saw the benchmark S&P 500 (SP500) advance nearly 20%, the index has now ended in the red in both August and September. The path ahead looks uncertain and the big question is whether a soft landing – a scenario where inflation is tamed through a cyclical slowdown in economic growth without entering recession – can still be achieved.
“The good news is the market, on some metrics, is now the most oversold since the fall of 2022 … The weight of the evidence suggests the market is getting closer to a point where we can see an oversold bounce, the sustainability of which will be dependent on yields cooling from the current elevated levels and the upcoming earnings season,” Lerner added.
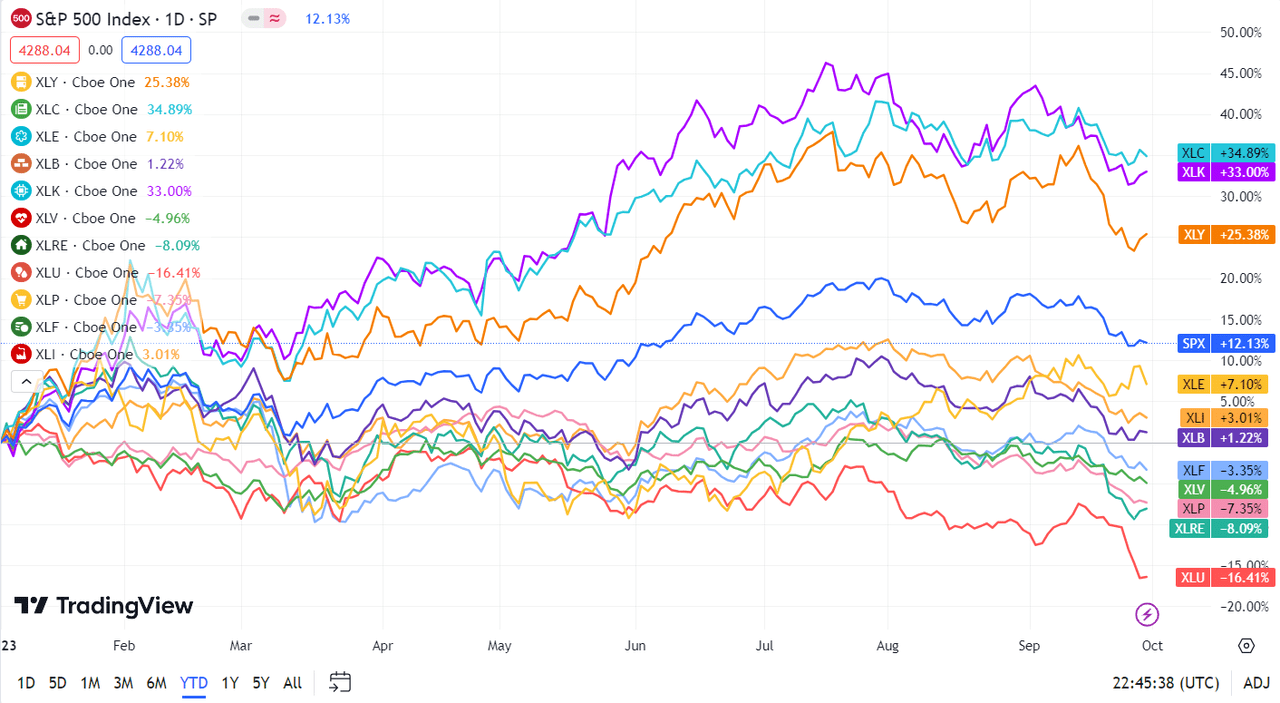
Turning to the monthly performance of the S&P 500 (SP500) sectors, all 11 ended in the red, with the exception of Energy. Rate-sensitive sector Real Estate was the top loser with a fall of nearly 8%. Technology came in second, falling about 7%. See below a breakdown of the performance of the sectors as well as their accompanying SPDR Select Sector ETFs from August 31 close to September 29 close:
#1: Energy +2.46%, and the Energy Select Sector SPDR ETF (XLE) +1.65%.
#2: Health Care -3.10%, and the Health Care Select Sector SPDR ETF (XLV) -3.36%.
#3: Financials -3.25%, and the Financial Select Sector SPDR ETF (XLF) -3.52%.
#4: Communication Services -3.27%, and the Communication Services Select Sector SPDR Fund (XLC) -3.19%.
#5: Consumer Staples -4.79%, and the Consumer Staples Select Sector SPDR ETF (XLP) -5.43%.
#6: Materials -5.05%, and the Materials Select Sector SPDR ETF (XLB) -5.24%.
#7: Utilities -5.83%, and the Utilities Select Sector SPDR ETF (XLU) -6.40%.
#8: Consumer Discretionary -6.01%, and the Consumer Discretionary Select Sector SPDR ETF (XLY) -5.70%.
#9: Industrials -6.06%, and the Industrial Select Sector SPDR ETF (XLI) -6.33%.
#10: Information Technology -6.91%, and the Technology Select Sector SPDR ETF (XLK) -6.68%.
#11: Real Estate -7.82%, and the Real Estate Select Sector SPDR ETF (XLRE) -7.97%.
Below is a chart of the 11 sectors’ YTD performance and how they fared against the S&P 500 (SP500). For investors looking into the future of what’s happening, take a look at the Seeking Alpha Catalyst Watch to see next week’s breakdown of actionable events that stand out.


